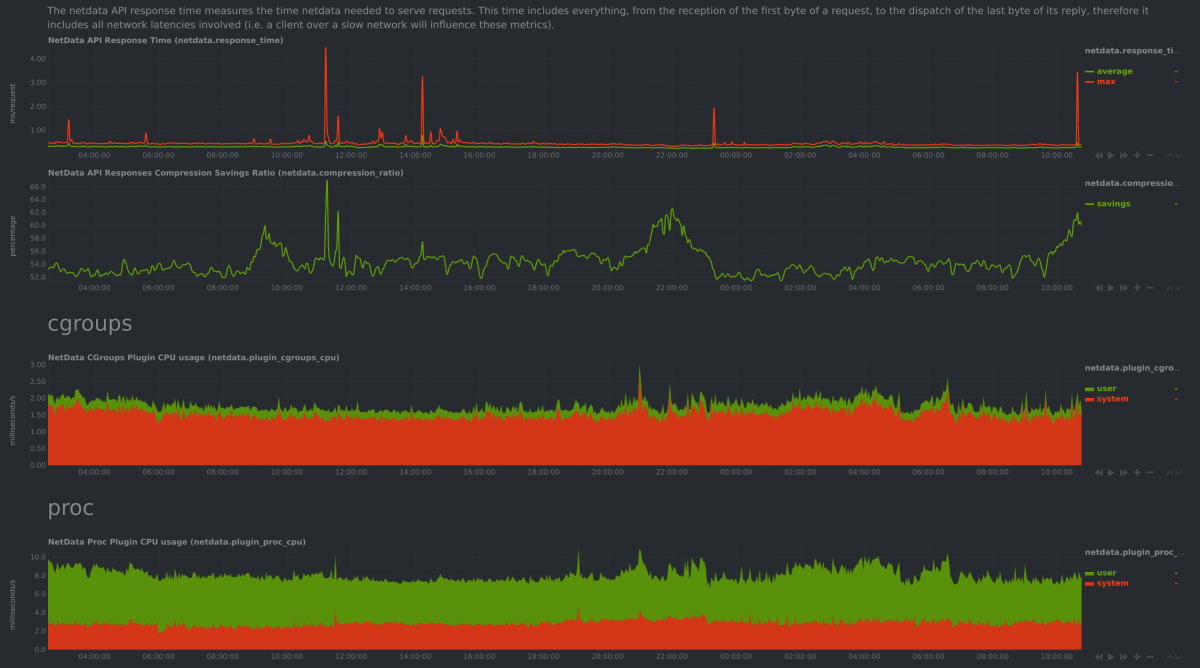
Netdata collects thousands of metrics per server per second, with just 1% CPU utilization of a single core, a few MB of RAM and no disk I/O at all. View everything on stunning real-time interactive web dashboards, even when it is running on low-end hardware.
Getting started
First of all, you will need to update the package repository by running the following command:
sudo apt-get update && sudo apt-get upgrade
One line installation, on any modern Linux system
(the suggested way of installing the latest netdata and keep it up to date automatically)
bash <(curl -Ss https://my-netdata.io/kickstart.sh)
(do not sudo this command, it will do it by itself as needed)
Linux 64bit, pre-built static binary installation
For any Linux distro, any kernel version – for Intel/AMD 64bit hosts.
bash <(curl -Ss https://my-netdata.io/kickstart-static64.sh)
(do not sudo this command, it will do it by itself as needed and also the target system does not need bash installed)
You can start, stop and get the status of the service by running the following command:
sudo systemctl start netdata
sudo systemctl stop netdata
sudo systemctl status netdata
Access to the Web Interface
Open your web browser and type the URL http://your-server-ip:19999. It will automatically redirect you to the dashboard as shown in the below image.
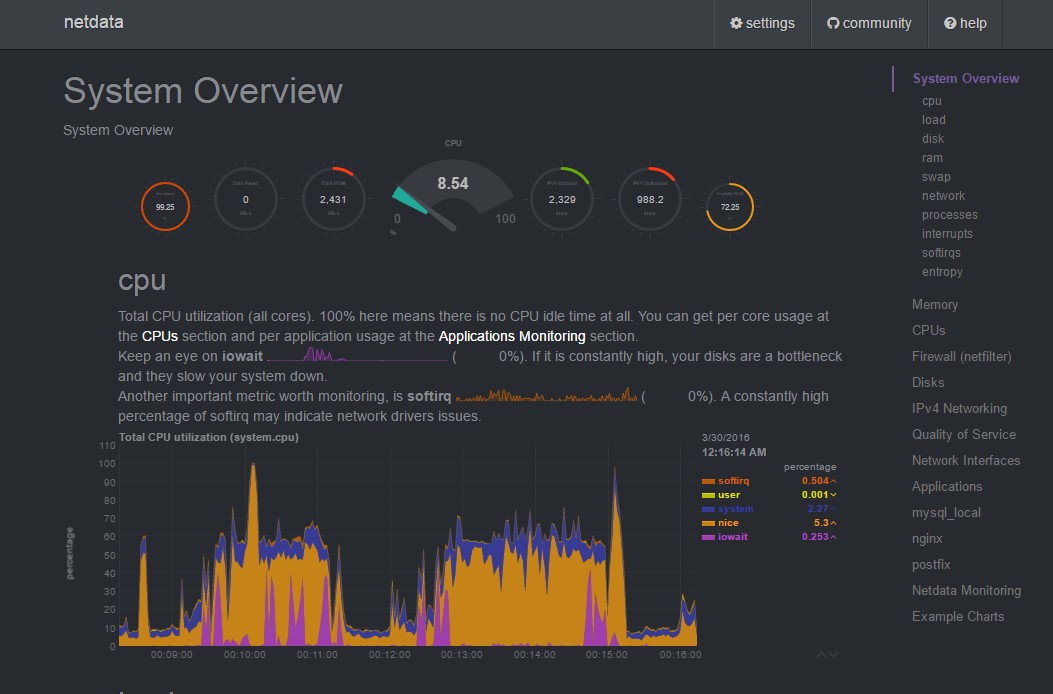
Congratulations! You have successfully installed Netdata!
Visit the official website for more: https://my-netdata.io/